The Polygraph Place

Thanks for stopping by our bulletin board.
Please take just a moment to register so you can post your own questions
and reply to topics. It is free and takes only a minute to register. Just click on the register link


  Polygraph Place Bulletin Board
  Professional Issues - Private Forum for Examiners ONLY
  name that EDA

Post New Topic  Post A Reply
profile | register | preferences | faq | search

next newest topic | next oldest topic
Author Topic:   name that EDA
rnelson
Member
posted 05-28-2012 10:20 PM     Click Here to See the Profile for rnelson   Click Here to Email rnelson     Edit/Delete Message
Test your skills...

Name that EDA.

1)

2)

3)

4)

r

------------------
"Gentlemen, you can't fight in here. This is the war room."
--(Stanley Kubrick/Peter Sellers - Dr. Strangelove, 1964)


IP: Logged

clambrecht
Member
posted 05-28-2012 11:22 PM     Click Here to See the Profile for clambrecht   Click Here to Email clambrecht     Edit/Delete Message

Examples of how EDA can be displayed/filtered?

1: Manual/Unfiltered
3: Automatic Mode
4: Detrended Mode

Not sure on # 2.

IP: Logged

Barry C
Member
posted 05-29-2012 02:29 PM     Click Here to See the Profile for Barry C   Click Here to Email Barry C     Edit/Delete Message
Help me out. What are you looking for us to name, exactly?

IP: Logged

rnelson
Member
posted 05-29-2012 05:56 PM     Click Here to See the Profile for rnelson   Click Here to Email rnelson     Edit/Delete Message
clambrecht:

you could at least try with #2

Barry:

EDA mode or instrument.

All of these plots are done in Excel, not the polygraph software.

more later -

r

------------------
"Gentlemen, you can't fight in here. This is the war room."
--(Stanley Kubrick/Peter Sellers - Dr. Strangelove, 1964)


IP: Logged

Ted Todd
Member
posted 05-30-2012 09:20 AM     Click Here to See the Profile for Ted Todd     Edit/Delete Message
Ray,

#1 Looks like an old analog EDA.
#2 and #4 look like defective digital EDAs
#3.Looks like a good digital EDA.

Did I win a prize?

Ted

IP: Logged

Dan Mangan
Member
posted 05-30-2012 09:32 AM     Click Here to See the Profile for Dan Mangan     Edit/Delete Message
I'll play...

It appears to be the same signal undergoing different forms of filtration or processing.

Ray, I know you said the plots are on Excel, but are the plots showing the signals as they would be treated and displayed on four different manufacturers' instruments?

IP: Logged

rnelson
Member
posted 05-30-2012 09:41 AM     Click Here to See the Profile for rnelson   Click Here to Email rnelson     Edit/Delete Message
Ted:

The best rewards are always intrinsic - personal satisfaction for a job well done. Everything else is, after all, temporal and transitory.

#4?

What do you think of this one?

5)

r

------------------
"Gentlemen, you can't fight in here. This is the war room."
--(Stanley Kubrick/Peter Sellers - Dr. Strangelove, 1964)


IP: Logged

rnelson
Member
posted 05-30-2012 09:48 AM     Click Here to See the Profile for rnelson   Click Here to Email rnelson     Edit/Delete Message
Dan,

You are correct.

It is the same signal processed different ways.

I may or may not be able to replicate the exact procedural details and coefficients that each manufacturer uses to process the data, but I can try.

So which is which?

Also, try this one.

6)

r

------------------
"Gentlemen, you can't fight in here. This is the war room."
--(Stanley Kubrick/Peter Sellers - Dr. Strangelove, 1964)


[This message has been edited by rnelson (edited 05-30-2012).]

IP: Logged

rnelson
Member
posted 06-01-2012 11:58 PM
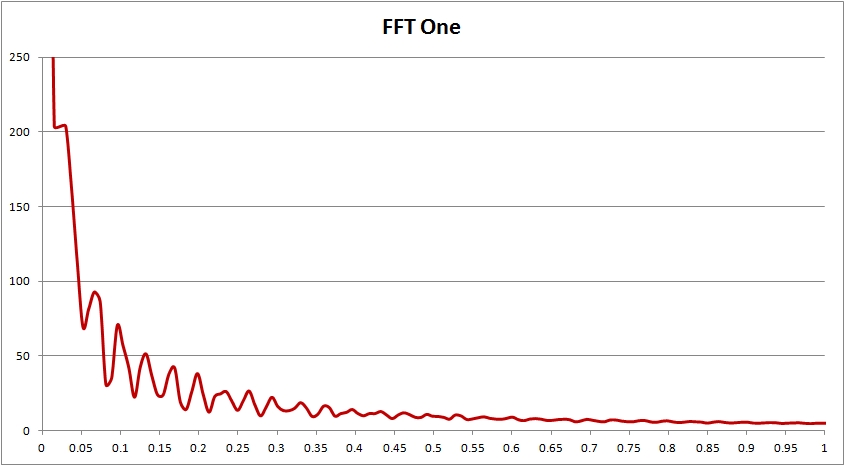
     Click Here to See the Profile for rnelson   Click Here to Email rnelson     Edit/Delete Message
More info:

A Fast Fourier Transform (FFT) plot of the frequency spectrum of the EDA plots. The horizontal axis shows frequencies from 0 to 1hz, while the vertical axis shows the strength or valume of data at each frequency.

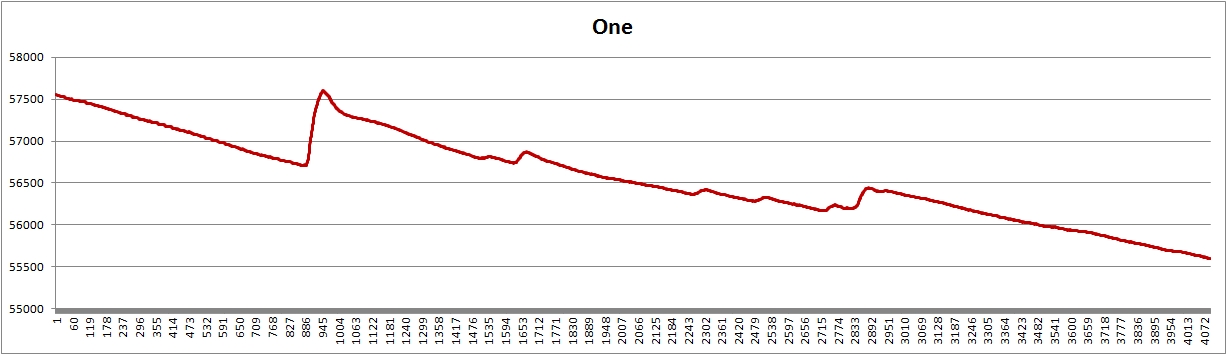
EDA 1 is manual EDA, and is unfiltered raw data as converted from the analog circuit to digital data. You can see a large increase in the strength of the very low frequencies below .05hz. There is an even more massive increase in the strength of signals at about .01hz - this is the descending noise in the manual EDA of some individuals. You can also see that there is a lot less activity over .5 hz and a much flatter response as the data approach 1hz. In the plot you can see the descending pattern that Dawson et al 2000 and Boucsein 1992 describe as a well known phenomena for some individuals. If you are used to seeing EDA that doesn't descend, then it is very likely that the data are being managed on your behalf. The present data were selected precisely because of the descending pattern - to study it. The descending trend is actually very low frequency noise. That descending noise is not from the system - it is a known phenomena in psychophysiology. Human skin, attached to the human nervous system, does not seem to behave exactly the same as dummy resistors.

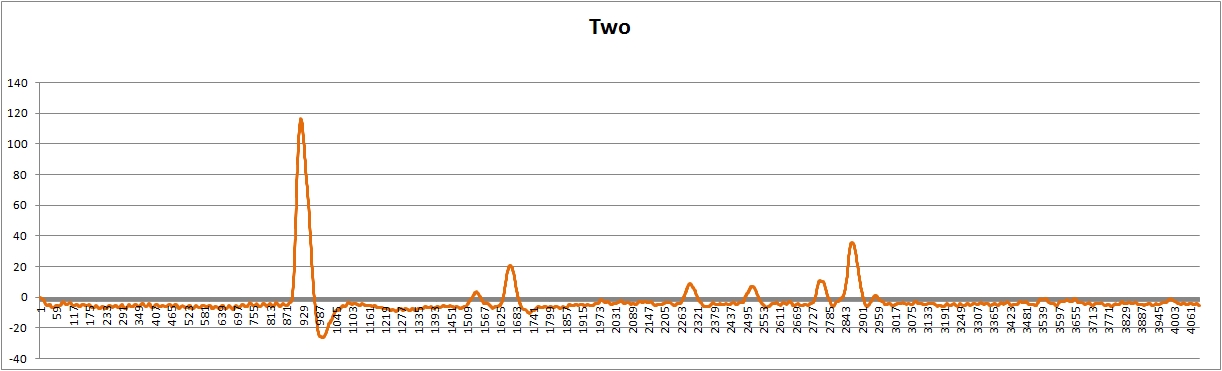
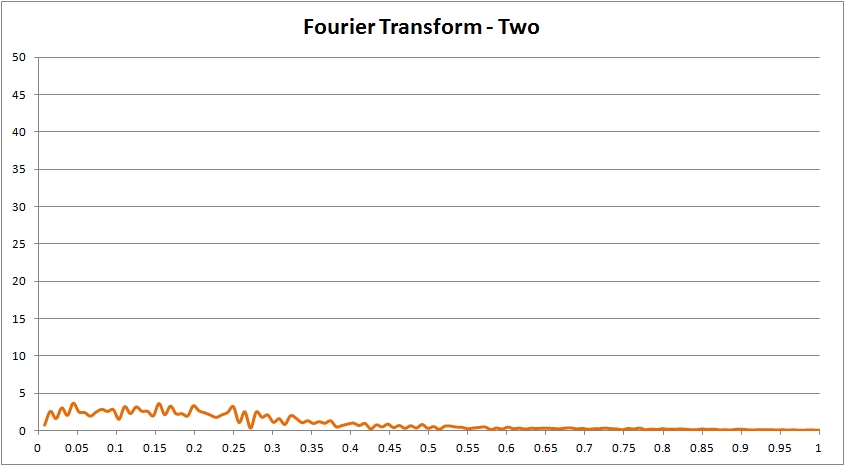
EDA2 is the same data passed through a fairly strong filter chain of low-pass (smoothing) and high pass filter at .8hz. The high pass filter is Y = X-X' + Y' * Ycoef where Y is each output data point, X is the current input data point * Xcoef, X' is the previous value of X, and Y' is the previous output data point. This is an Infinite Impulse Response filter (IIR) that continuously carries forward some small portion of each data point. Xcoef and Ycoef are coefficients that are calculated to provide the .8hz filter cutoff at the given sampling rate. Because frequency data is a function of angular momentum, coefficients will be different at different sampling rates. Note the difference in vertical scale for FFT plot 2.

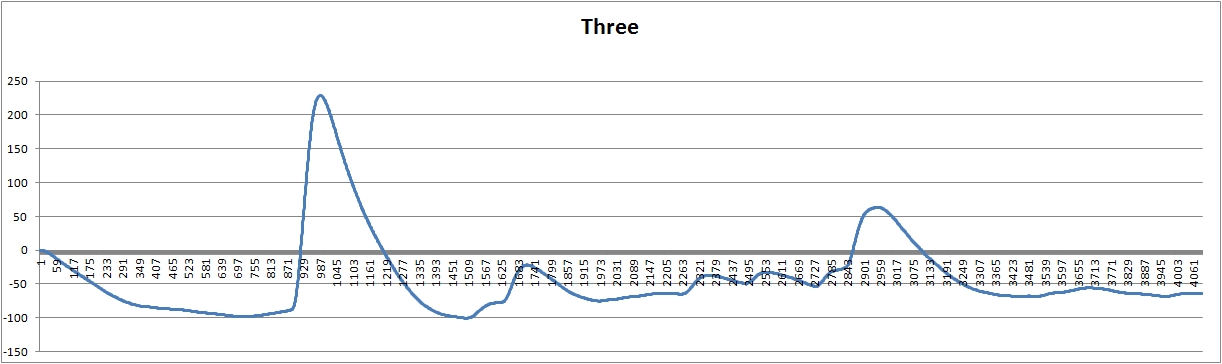
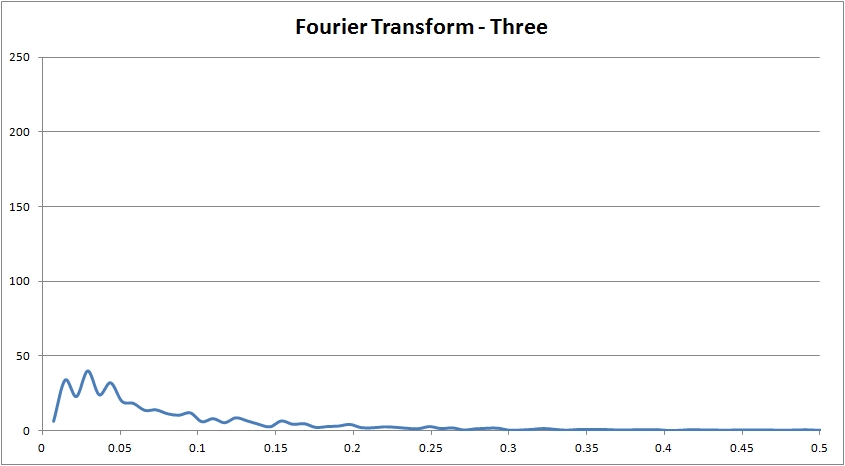
EDA 3 is a high pass filter with a cutoff frequency of .05hz. You can see that even though frequencies under .05hz are filtered (reduced), the data in this frequency range was so strong in the raw data that these are still the strongest frequencies in the spectrum. As Ted Todd indicated, EDA 3 tends to look a lot like some of the good digital EDA that is available to field examiners today.

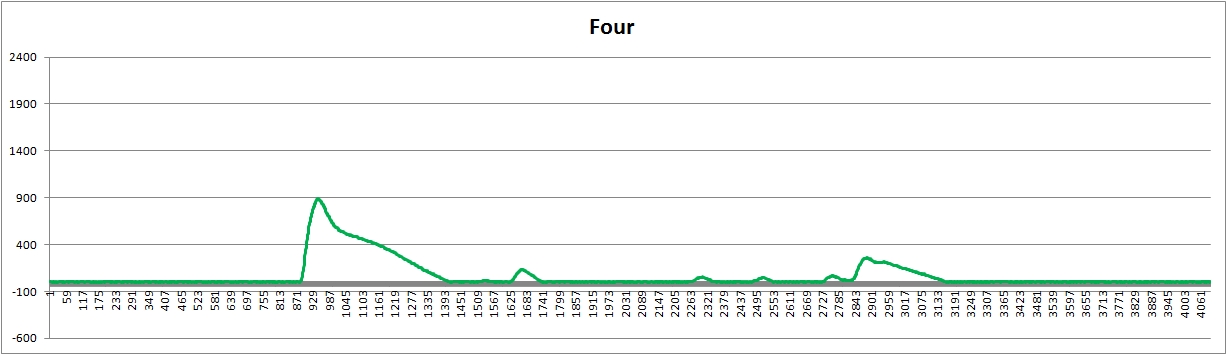
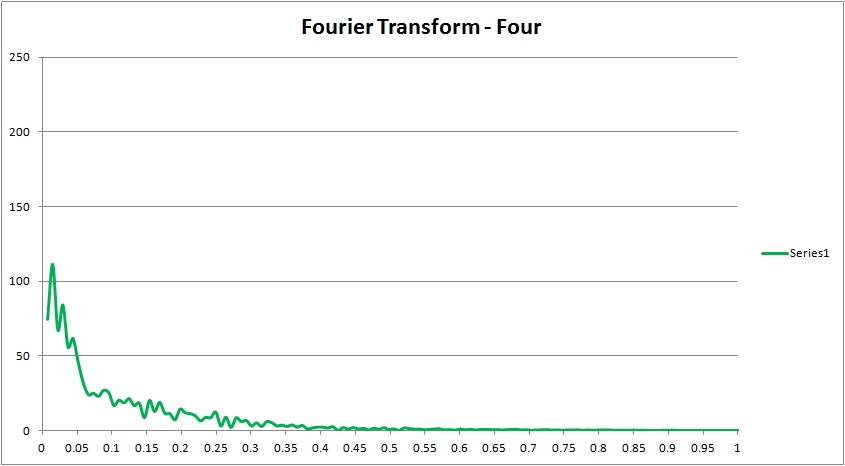
EDA 4 is similar to the detrended EDA data in the LX Software. This version of the filter works by starting at zero and allowing all upward activity (indicative of sympathetic autonomic activation) to plot normally without any filtering. When the data are not ascending the data are assisted to recenter at the zero baseline with a recentering coefficient. Data is permitted to descend to the zero baseline and held at the baseline. At the onset of any additional upward activity the data are plotted again without any filtering. In this way, all upward (sympathetic) segments will be plotted with exact correspondence to the manual EDA data. The difference between detrended and manual EDA data is that all reactions will begin at the zero baseline, unless they begin at a point that has not yet fully descended to the baseline.

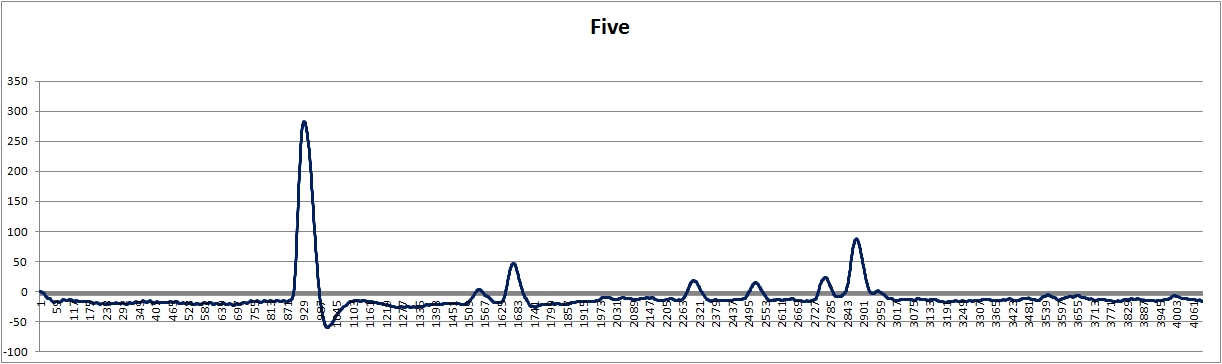
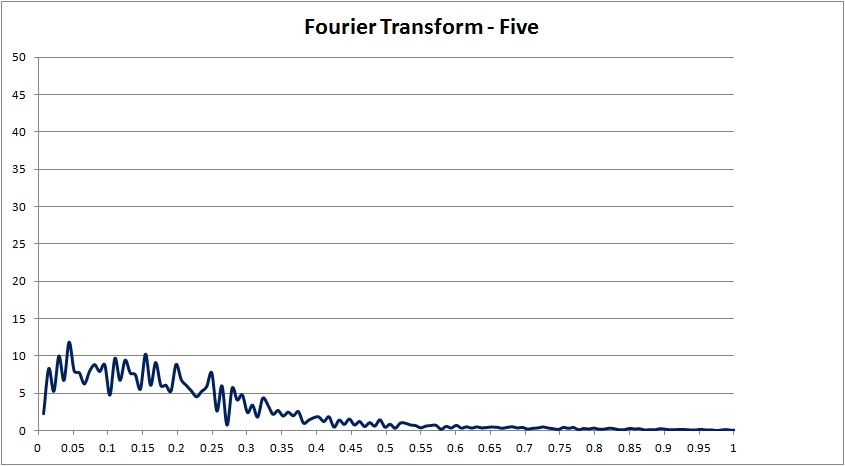
EDA 5 was an attempt to improve the characteristics of EDA 2, by changing the filter coefficients to achieve a 1hz cuttoff. EDA 5 has less less noise at the baseline (actually low frequency noise, but us examiners probably consider it higher frequency electrodermal activity). Like EDA 2, EDA 5 has a prominent rebound after the data are recentered following the large reaction. Engineers call this "ringing," while examiners call it rebound. It is like a sprinter with so much momentum that he runs past the finish line, and then has to return. The problem with this filtering artifact is that examiners may tend to regard any upward activity as indicative of sympathetic nervous system activation, while upward activity in the rebound or ringing segment is a filtering artifact and not sympathetic activity. Like EDA 2, the FFT plot for EDA 5 shows a lot of activity over .1hz. The vertical scale for FFT plot 5 is different than others and similar to the scale of FFT plot 2.

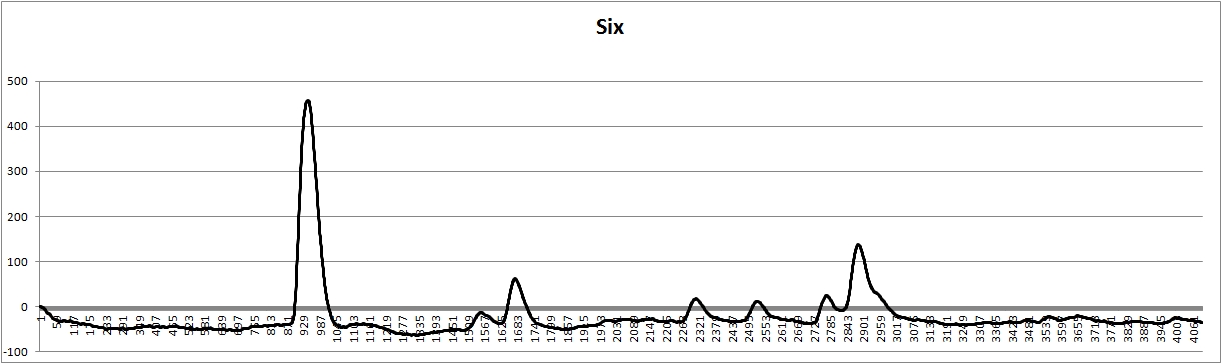
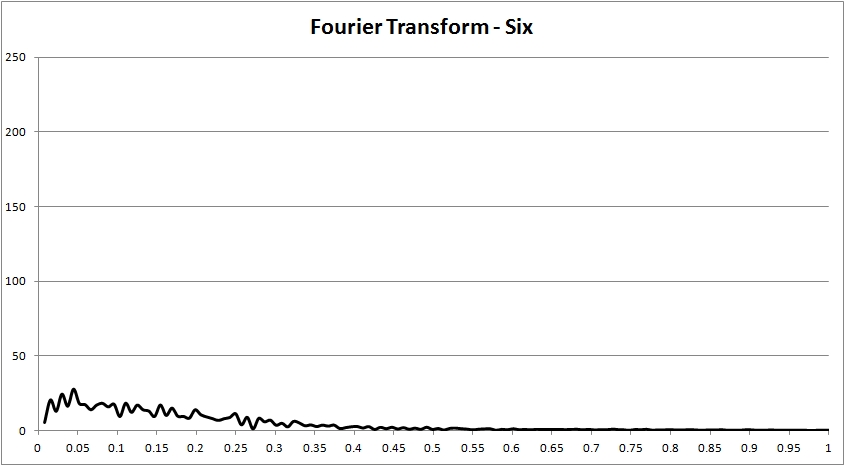
EDA 6 is an attempt to reduce the ringing/rebounding in EDA 2 and EDA 5 by changing the high pass cutoff frequency to .1hz. You can still see a lot of activity below .05 - that is probably the activity we are actually looking for in the reactions we score. The FFT plot for EDA 6, like EDA 3 and EDA 4, shows the relative reduction of activity over .1hz compared to the low frequency activity that we want.

The point in all this is to show that the same raw EDA signal can be processed to different advantages. Some are easier to use than others. Strong filters can attenuate duration substantially. It is also possible to develop EDA data that recenters automatically, maintains differences in response duration, and does not introduce exessive ringing/rebounding.

r

------------------
"Gentlemen, you can't fight in here. This is the war room."
--(Stanley Kubrick/Peter Sellers - Dr. Strangelove, 1964)

[This message has been edited by rnelson (edited 06-02-2012).]

IP: Logged

rnelson
Member
posted 06-14-2012 04:29 PM     Click Here to See the Profile for rnelson   Click Here to Email rnelson     Edit/Delete Message
The chart segment from which all the EDA plots and spectrum analysis were calculated.

Point of all this is that it is probably a good idea to get to know your EDA.

The suggestion that one is better than another remains unstudied and unproven.

There are advantages and disadvantages to all solutions. Some are easy. Some are ugly. Some do very little to the data. Some do a little more.

Simplistic analysis is that if you are looking at symetrical EDA tracings on the instrument of your choice, the data are probably managed through some form of filtering whether you realized it or not.

To me it seems important to know what is being done.

EDA #1 is raw unfiltered EDA, and exhibits the phenomena of descending that Boucsience, Dawson and other researchers describe in their scientific publications. This happens with some, but not all, individuals. Those who use the PolyScore algorithm will recall that the algorithm performs some detrending to reduce the offending frequency that results in the downward slope. My first computerized polygraph was accompanied by a recommendation from the manufacturer to keep the hardware switch int he auto position and not use manual EDA. Take home point is that if raw EDA data is pretty and symmetrical and never shows any descending pattern for anyone then the odds are high that the EDA is being managed somehow without our knowledge. Raw EDA data is like raw engredients - it doesn't always look just like the finished product (if it does, then it ain't raw).

EDA #2 is my attempt to replicate the EDA from my first coputerized polygraph. The data are filtered with a high pass filter using a cutoff frequency of .8hz. What you get are fast, beautifully obvious reactions from a controlled baseline, along with fast symmetrical recovery segments. The price is some ringing/rebounding on recovery from strong reactions.

EDA #3 is the Lafayette Automatic mode included in the current software. Actually it is my replication of the automatic mode - using a low-pass filter to remove high frequency noise and retain all low frequency data, and then a high pass filter to remove the ultra-low frequency descending noise. Both corner frequencies are .05hz. The filter functions efficiently because of the tendency for the filter to roll into the corner frequencies.

EDA # 4 is my replication of the current detrended filter that will hold persistent descending data the baseline while allowing upward (sympathetic) data segments to be displayed unfiltered with the exact same amplitude as upward reactions in the manual/raw/unfiltered EDA.

EDA #5 was a lame attempt to clean up the higher frequency noise in EDA #2.

EDA #6 was another attempt to improve EDA #2. This one succeeded a little more at reducing the high frequency noise at the baseline and reducing the ringing/rebounding after the fast symetrical return to the baseline. This was accomplished by changing the high-pass coefficient to achieve a corner frequency of .1hz. It would be easy to use. However, duration data are lost,and complexity is badly damaged also.

Again, if you like the way your EDA look it is because somebody made it look that way.

My suggestion is that we should probably want to know more about what has been done, and that is the reason I am helping everyone sleep with all of this useless esoteric info on EDA signal processing.

Peace,

zzzzz

------------------
"Gentlemen, you can't fight in here. This is the war room."
--(Stanley Kubrick/Peter Sellers - Dr. Strangelove, 1964)


IP: Logged

All times are PT (US)

next newest topic | next oldest topic

Administrative Options: Close Topic | Archive/Move | Delete Topic
Post New Topic  Post A Reply
Hop to:

Contact Us | The Polygraph Place

Copyright 1999-2012. WordNet Solutions Inc. All Rights Reserved

Powered by: Ultimate Bulletin Board, Version 5.39c
© Infopop Corporation (formerly Madrona Park, Inc.), 1998 - 1999.